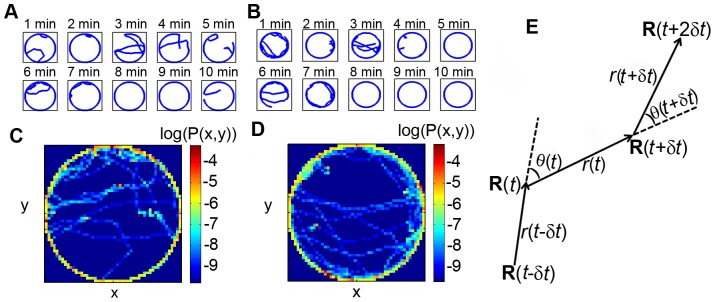
Figure 1. Position characteristics of a fly inside a circular arena of radius 4.2 cm.
Two experiments, each of 10 minute duration broken into 1 minute intervals, are shown in A and B. The spatial density, P(x,y), of the fly in A and B are shown in C and D, respectively, in logarithmic scale. The density plots clearly indicate that the fly prefers the boundary and has no angular preference along the boundary. In panel E, we illustrate turn angle,  , and step size,
  , in the two-component model. There are four consecutive locations of the fly at time
  ,
,  ,
,  and
and  . Turn angle
  at time
  is measured with respect to the direction of movement at the previous time step. The direction of movement at time
  is along the direction of vector
  . The step length
  at time
  is given by
  .
.

