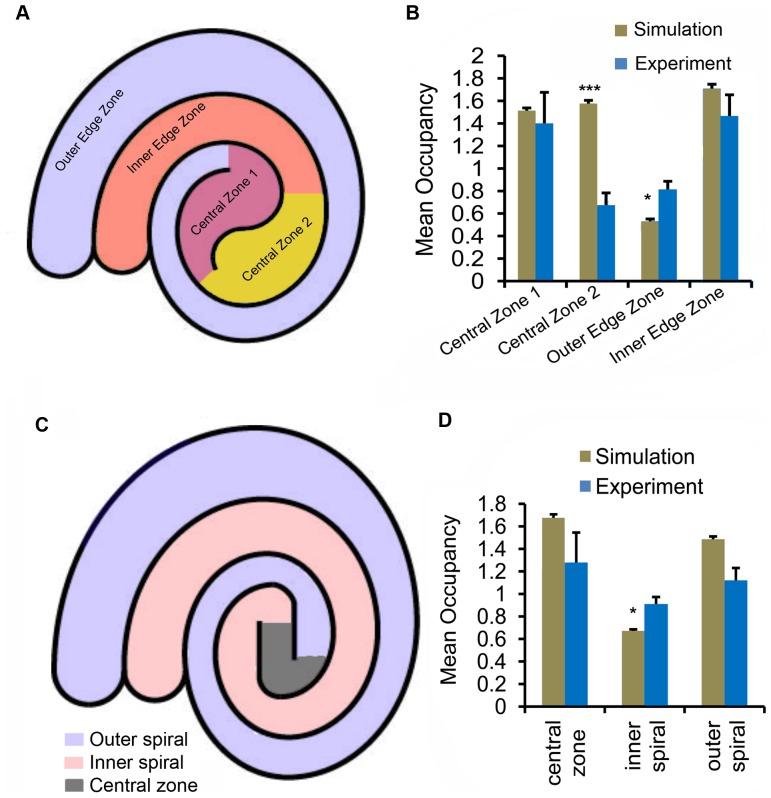
Figure 7. Positional preferences from experiments and simulations in two double spiral arenas.
The double spiral arenas are shown in panels A and C. Each arena was divided into different spatial zones. The mean occupancies in these zones for arena A and C are shown in B and D, respectively. In the spiral arenas, the occupancy was computed as a ratio of fraction of total time spent in a zone to the fraction of the total arena occupied by the zone. The asterix indicates significant difference between simulations and experiments (*:  , **:
, **:  , and ***:
  ).
).

