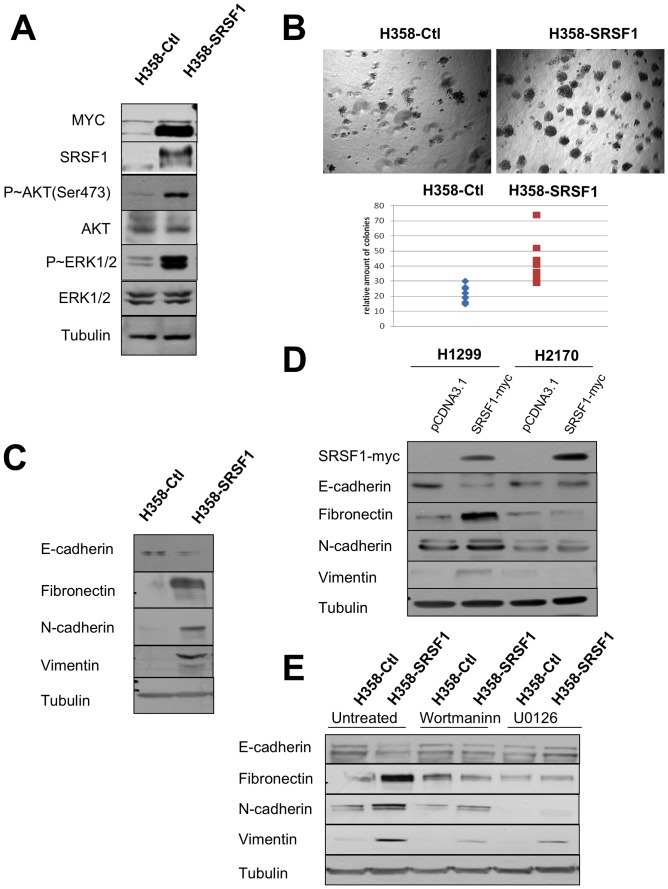
Figure 7. SRSF1 overexpression confers a more aggressive phenotype.
Western blot analyses (A, C, E) and soft agar assays (B) were performed in H358-Ctl and H358-SRSF1 cells that were cultured at the same passage. (A) Expression of SRSF1 and activation of AKT/ERK signaling pathways were analyzed by western blotting. Tubulin was used as a loading control. (B) Upper panels: representative images of colonies in soft agar. Magnification, ×500. Lower panel: relative amounts of colonies in eight representative fields. Three independent experiments were performed in quadriplicate. (C) Western blot analysis of epithelial and mesenchymal markers. Tubulin was used as a loading control. (D) H1299 and H2170 cells were transfected either with control pcDNA3.1 or with myc-tagged SRSF1 plasmid. Transfected cells were selected during 6 days with G418 (800 µg/ml) and western blot analyses were performed using the indicated antibodies. Tubulin was used as a loading control. (E) H358-Ctl and H358-SRSF1 cells were cultured for 72 hours in the presence or absence of 500 nM wortmaninn or 10 µM U0126 as indicated. Expression of epithelial (E-cadherin) and mesenchymal (fibronectin, N-cadherin, vimentin) markers was analyzed by western blotting. Tubulin was used as a loading control.

