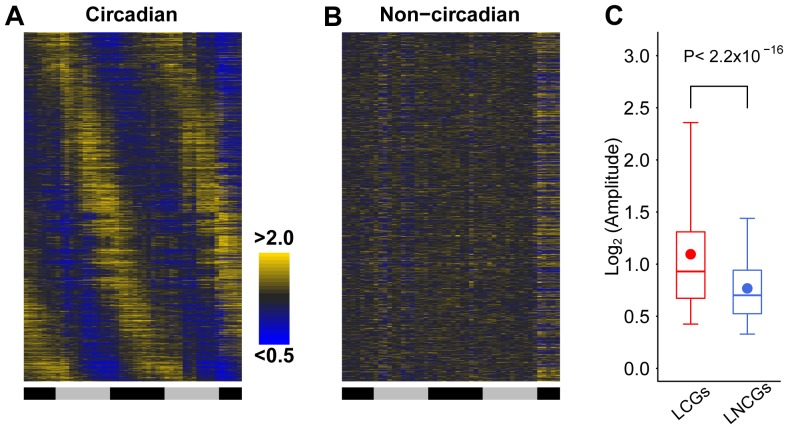
Figure 1. Expression profiles and amplitudes of the murine LCGs and LNCGs.
A heatmap shows temporal expression profiles of LCGs (A) and LNCGs (B) based on median-normalized values. Expression levels are segregated into at least 2-fold or more (yellow) and 50 percent or less (blue) than the median intensity values, respectively. The horizontal bars indicate temporal phases in circadian day (black) and night (grey). The amplitude (C) of LCGs (red) or LNCGs (blue) are shown in a box plot, which is estimated by calculating the peak-to-trough ratio ( = percentile[0.95, x]/percentile[0.05, x]). The boxes depict data between the 25th and 75th percentiles with central horizontal lines and solid circles representing the median and mean values, respectively, and with whiskers showing the 5th and 95th percentiles. P-values are calculated based on the Wilcoxon rank sum test.

