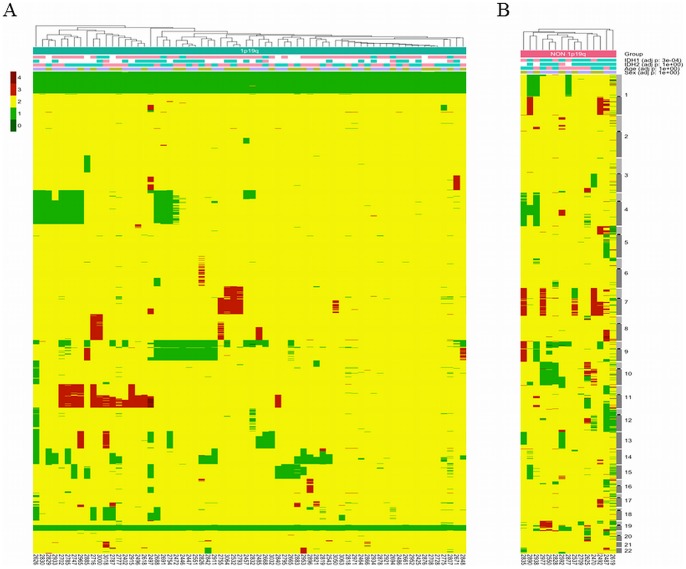
Figure 1. Heat map with genomic profiles of anaplastic oligodendrogliomas.
Each column indicates a tumor. Each row indicates a genomic locus. Tumors were clustered based on the Euclidean distance between their copy number vectors. The color code on the left-upper corner indicates the genomic status: yellow, green and red indicate a normal status, loss and gain, respectively. In addition, the IDH1 mutation (pink indicates mutated IDH1/2, while IDH1/2 indicates non-mutated IDH1/IDH2), patient age (blue and pink indicate younger and older, respectively, than the median age of the entire population, 49.9 years old) and patient gender (purple indicates male, while brown indicates female) are reported at the top of the figure. The p-value on the right indicates the distribution of the variables between the 1p19q- and non-1p19q-co-deleted tumors. Panel A. 1p/19q-co-deleted anaplastic oligodendrogliomas, with chromosomes 1 and 19 centromeric breakpoints. Panel B. Non-1p/19q co-deleted anaplastic oligodendrogliomas. The legend is the same as the one used in Panel A.

