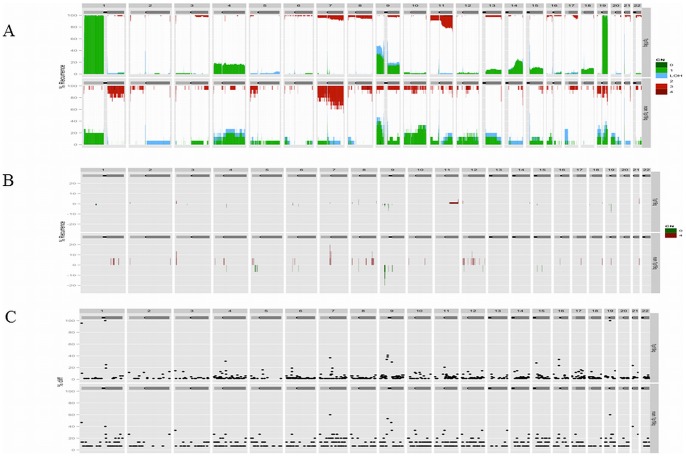
Figure 2. Frequency of genomic alterations in the 1p/19q-co-deleted anaplastic oligodendrogliomas on the top part of the panel and non-1p/19q-co-deleted anaplastic oligodendrogliomas on the bottom part.
Panel A. Genomic gain, genomic loss and uniparental disomy are indicated in red, green and blue, respectively. Panel B. High-level amplification and homozygous deletion are indicated in red and green, respectively. Panel C. Genomic breakpoints are indicated with a black dot across the genome.

