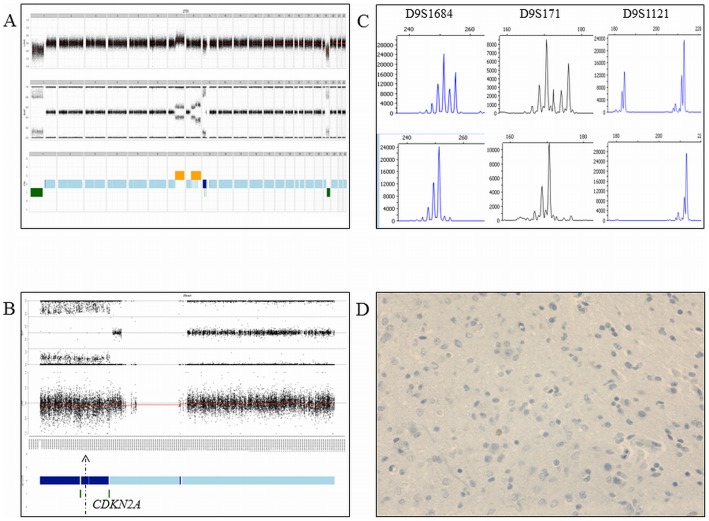
Figure 4. An anaplastic oligodendroglioma with CDKN2A silencing, normal CDKN2A gene copy number status and copy neutral loss of heterozygosity.
Panel A. Top part: Genomic profile with the copy number status. Middle part: Genomic profile with the allelic frequencies. Bottom part: The genomic profile including genomic loss (in green), normal copy number status (light blue) and copy neutral loss of heterozygosity (dark blue). Panel B. Chromosome 9 and the allelic frequencies (the arrow indicates the CDKNA locus). Panel C. Microsatellite analysis showing the allelic status of three markers (D9S1684, D9S171, D9S1121) in the blood DNA (top part) and paired tumor DNA (bottom part). Acquired allelic loss is observed in the tumor DNA Panel D. CDKN2A silenced using immunochemistry.

