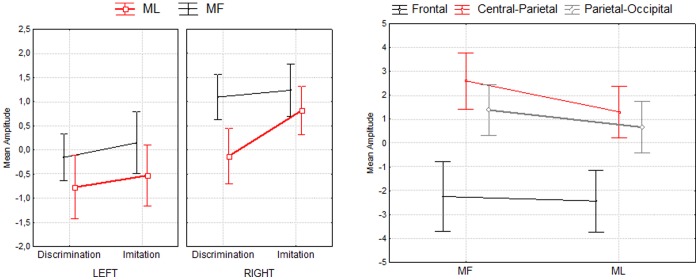
Figure 3. Second time window (925–1075 ms).
Mean amplitude of MF and ML actions at the middle time window (925–1075 ms). The right plot depicts overall mean amplitude of MF and ML actions for each of the 3 ROIs. The left plot depicts mean amplitude of MF and ML actions for each task (imitation, discrimination) in the left and right hemisphere. Error bars denote 95% confidence intervals.

