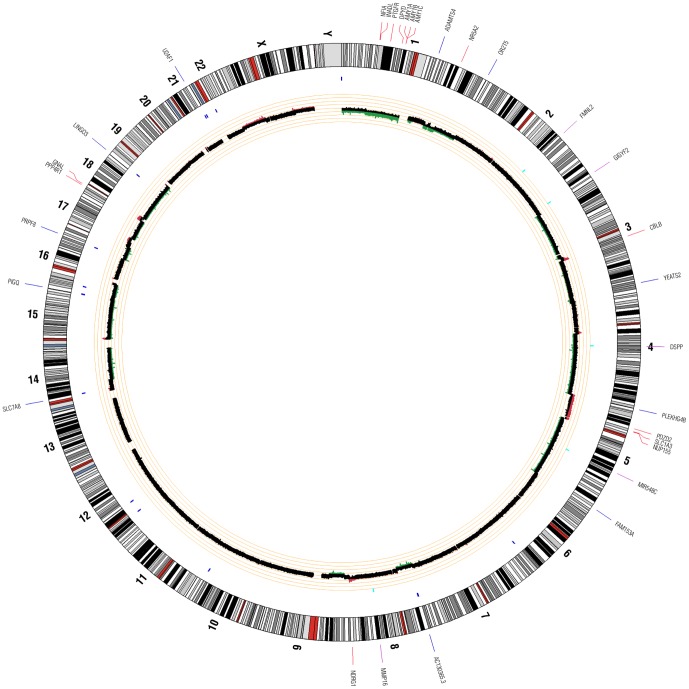
Figure 2. Patient 2 Circos Plot.
This plot summarizes all significant genomic events that were identified in patient 2 using WGS. Copy number changes are shown in the inner circle plot with red marking amplifications and green marking deletions. SNVs are indicated with dark blue tick marks and indels are indicated with light blue tick marks.

