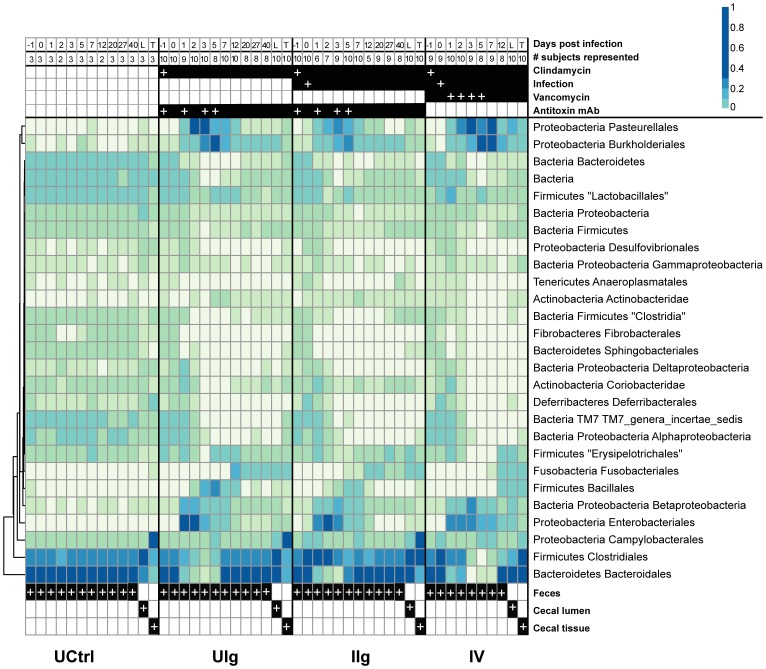
Figure 4. Taxonomic heatmap of fecal and cecal bacterial communities demonstrating large-scale community shift and multiple waves of succession following clindamycin administration.
Heatmap showing relative abundance of taxa as a percent of total 16S rRNA tag reads. Each column represents the read-aggregated mean community for that treatment group and day, each row represents a taxon. The uninfected, clindamycin-naïve group is mostly stable and homogenous for the entirety of the experiment, while clindamycin induces a large-scale perturbation in the microbiota. The numbers of animals and the treatments are shown at the top (white plus (“+”) signs indicate dates of administration) and sample origin at the bottom. Proportion contributed by each taxon is shown by the color scale at the top right.

