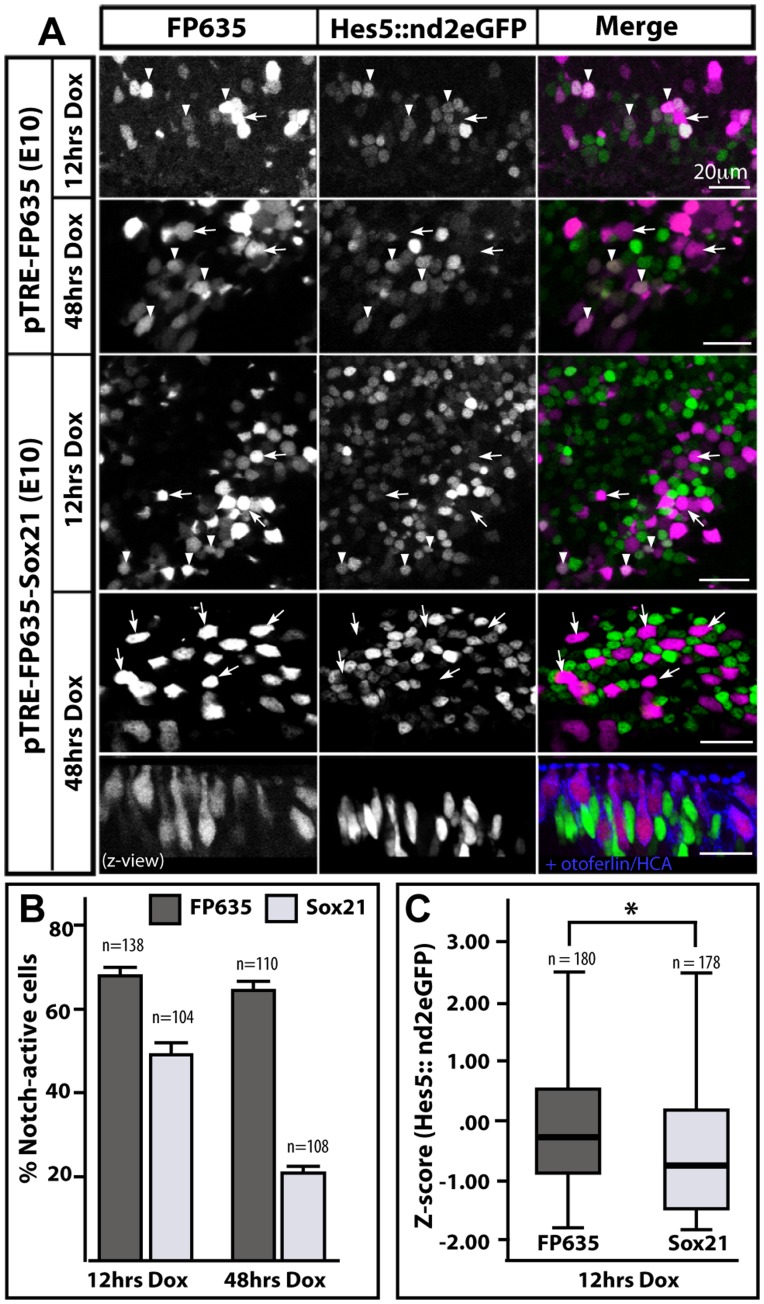
Figure 6. Induction of sox21 causes a progressive reduction in levels of Notch activity.
(A) surface views of E10 vestibular patches transfected with the pT2K-Hes5::nd2eGFP reporter and either pTRE-FP635 (control) or pTRE-FP635-Sox21 and treated in vitro with Dox for 12 or 48 hours. In control samples, the proportion of FP635-positive cells that were either positive (arrowheads) or negative (arrow) for nuclear Hes5::nd2eGFP expression was comparable after 12 or 48 hours Dox treatment. In contrast, the number of Sox21-FP635 induced cells positive for Hes5::nd2eGFP expression was reduced at both 12 hours and 48 hours of Dox treatment. In the 48 hours example shown, all FP635-Sox21 are negative for Notch activity (white arrows); the transverse reconstruction of the same region (z-view panel) also demonstrate expression of otoferlin/HCA in FP635-Sox21 induced cells. (B) Graph showing the proportion of Notch-active (mean intensity of nuclear d2eGFP signal >500 above background in a 12-bits image) cells among cells induced for FP635-only (FP635) or FP635-Sox21 (Sox21) expression after 12 and 48 hours Dox treatment; n = total number of transfected cells analysed in 3 samples. Standard error bars are shown. (C) Box plots of Z-scores values for Hes5::nd2eGFP fluorescence levels in supporting/progenitor cells transfected with either pTRE-FP635 (n = 180) or pTRE-Sox21-FP635 (n = 178) and treated for 12 hours with Dox. Minimum, first quartile, median, third quartile, and maximum are displayed. There were significantly lower levels of Hes5::nd2eGFP fluorescence in Sox21-FP635 expressing cells than in FP635 expressing cells (Mann-Whitney U = 11232; p = .00; n = total number of transfected cells analysed in 3 samples).

