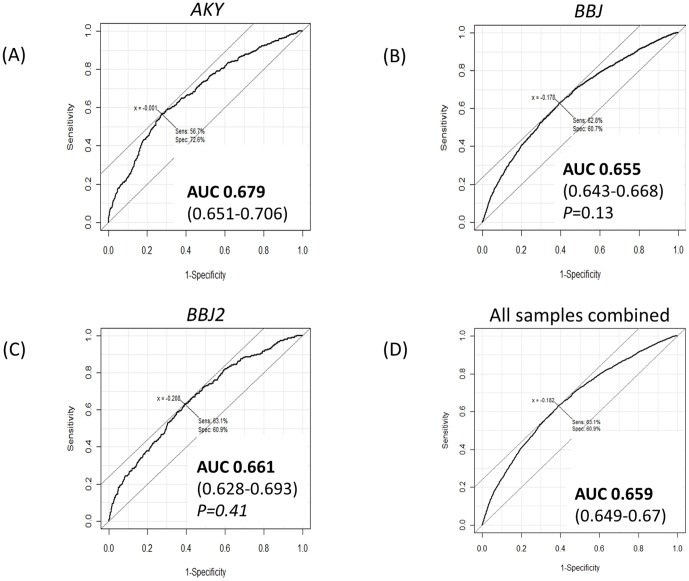
Figure 1. ROC curves for (A) the samples used to create the genetic risk prediction model (AKY), (B)(C) the two validation studies (BBJ and BBJ2), and (D) when all the samples were combined.
The AUCs of the model and 95% confidence intervals are indicated. The AUCs of BBJ and BBJ2 are statistically compared with that of AKY, and P-values are reported. (x: the logarithm of odds ratio at the best cut off, Sens: sensitivity of the model at the best cutoff, Spec: specificity of the model at the best cutoff.)

