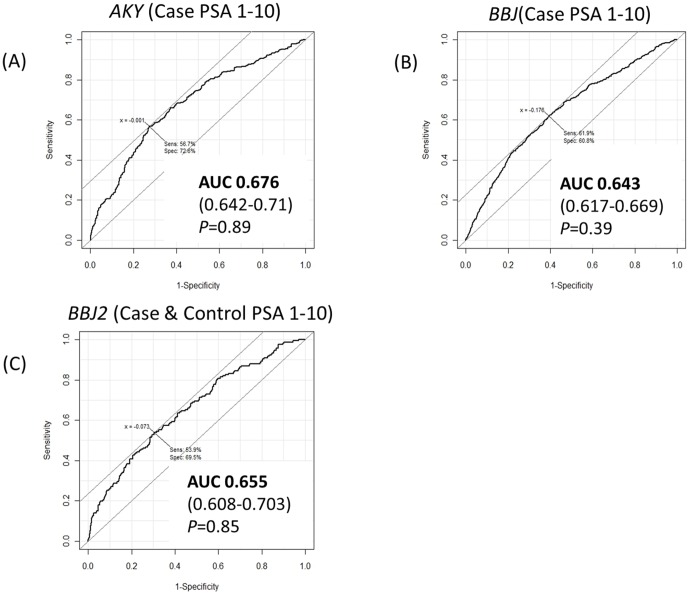
Figure 2. ROC curves of the genetic risk prediction model when the samples were confined to those with PSA 1–10 ng/ml.
In (A) AKY and (B) BBJ, case samples with PSA 1–10 ng/ml and all the control samples are used for analysis. In (C) BBJ2, samples are confined to those with PSA 1–10 ng/ml in both case and control samples. The AUCs of the model and 95% confidence intervals are indicated. In each of the sample sets, the AUCs are statistically compared to the AUCs when serum PSA level is not confined (as shown in Figure 1), and P-values are reported.

