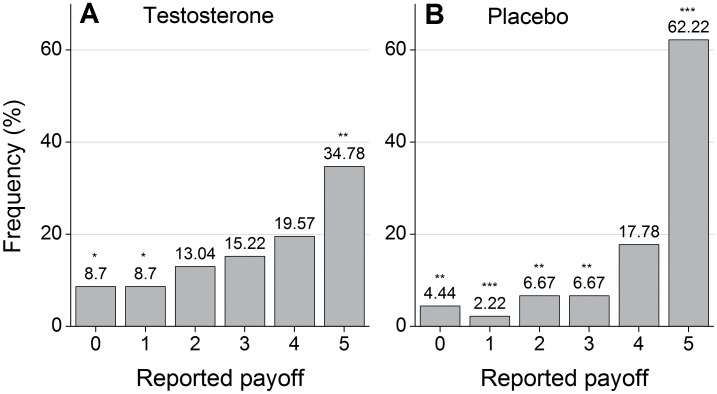
Figure 1. Distribution of reported payoffs.
a. Distribution for subjects who received testosterone. b. Distribution for subjects who received placebo. The stars on top of the bars indicate that in the testosterone group 5s are reported significantly more frequently and 0s and 1s are reported significantly less frequently than expected. Likewise in the placebo group 5s are reported more often and 0s and 1s, 2s, and 3s are reported less frequently than expected (Binominal tests that the observed frequencies are smaller/larger than 16.7 percent, *, **, *** indicate significance at 1%, 5%, and 10% level respectively, Placebo: n = 45; Testosterone n = 46).

