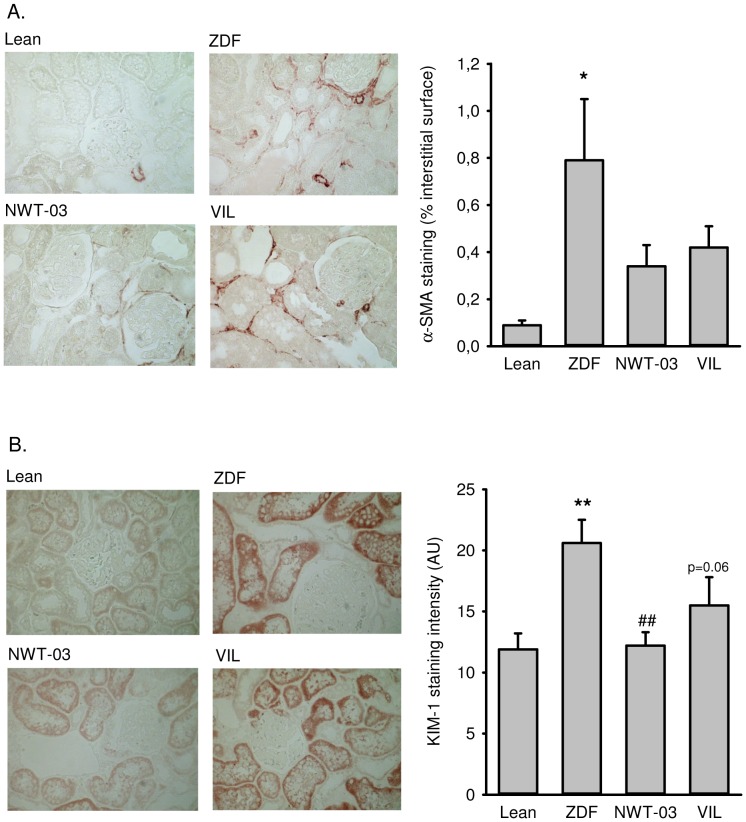
Figure 1. Renal expression of (A) α-SMA and (B) KIM-1.
Shown are representative pictures of lean control rats (top left) and untreated ZDF rats (top right), and ZDF rats supplemented with NWT-03 (bottom left) or treated with VIL (bottom right). Bars in the graphs represent the average per group, presented as means ± SEMs (*p<0.05 and **p<0.01 vs lean; ##p<0.01 vs ZDF).

