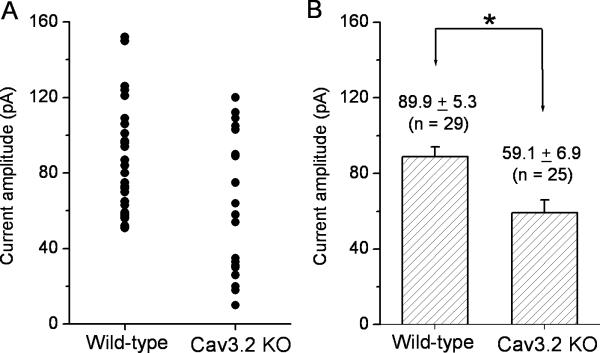
Figure 5. Comparison of T-type currents in type-3 cone bipolar cells between wild-type and Cav3.2 KO mice.
The T-type Ca2+ currents were evoked by depolarizing the membrane potential to −40 mV from the holding potential of −80 mV. (A) The current amplitude distribution for all recorded cells from wild-type and Cav3.2 KO mice. (B) The average values of the T-type Ca2+ currents for wild-type and Cav3.2 KO mice. These two values are significantly different (mean ± SE; P < 0.005).

