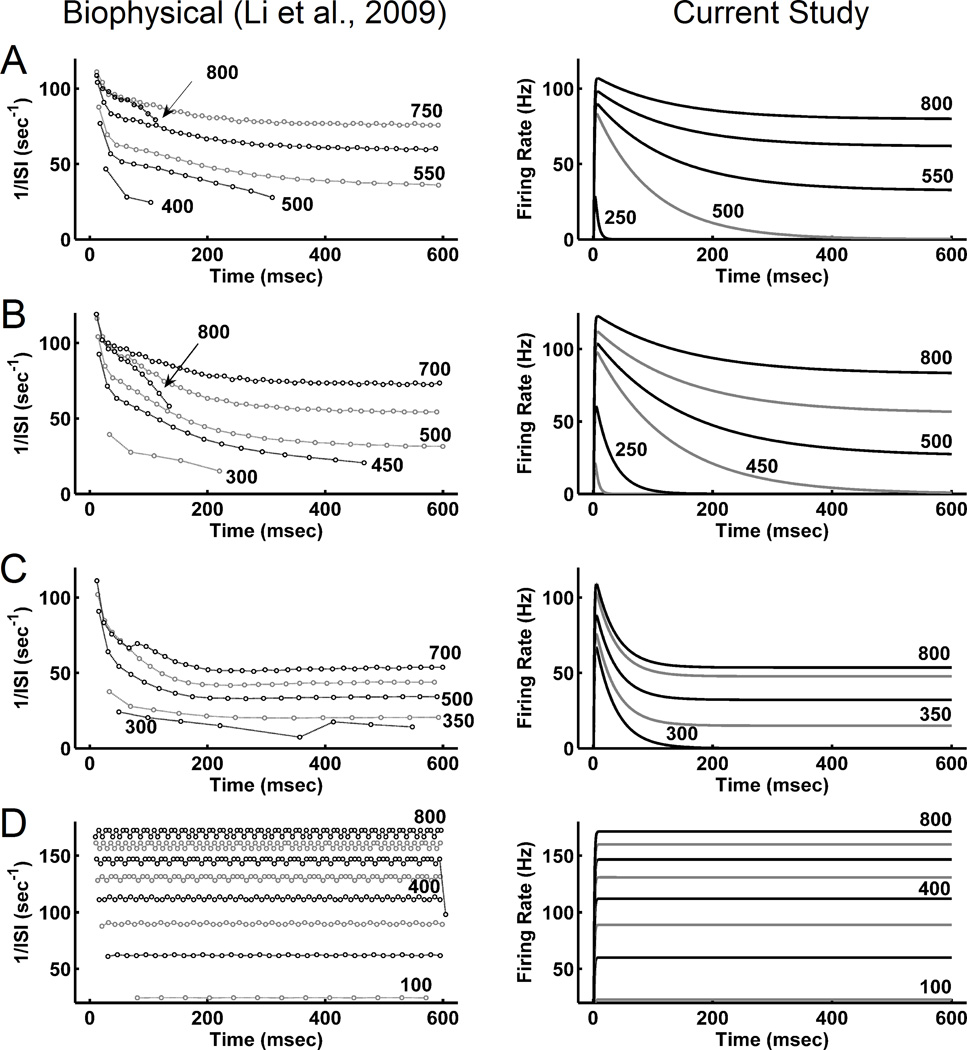
Figure 2.
Comparison of single cell firing-rate output in the biophysical (left) and firing-rate (right) LA model networks. Firing rates for detailed biophysical LA cell models in Li et al. (2009) were computed as 1/ISI. Each trace corresponds to the firing rate calculated for a spike train elicited with a 600 msec current injection (pA). Circles represent spike times at which the ISI was calculated. At current injections below those shown, some cells fired only a single spike, and so ISIs were not calculated. A) type A pyramidal cell, B) type B pyramidal cell, C) type C pyramidal cell, and D) Interneuron.

