
Figure 6.
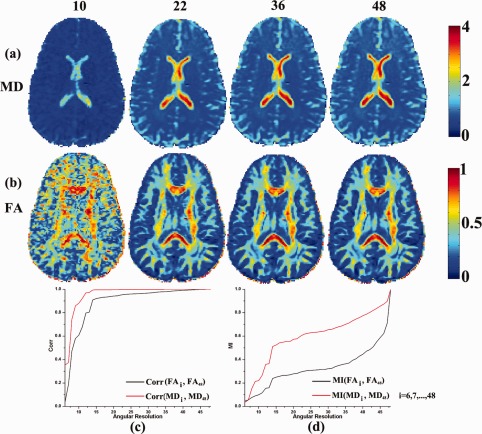
Angular resolution affects DTI‐derived scalar maps. At the top of the figure, we show the number of diffusion gradients (10, 22, 36, or 48) used to estimate the MD and FA maps, shown in rows (a) and (b). (c) Correlations are shown between between scalar maps derived from the highest angular resolution data versus the downsampled (lower angular resolution) data. As expected, the FA requires more angular samples to converge to its true value, while MD converges more quickly. (d) The MI value between scalar maps calculated from original angular resolution data and from downsampled angular resolution dataset. The MI curves are normalized to their maximum value. [Color figure can be viewed in the online issue, which is available at http://wileyonlinelibrary.com.]