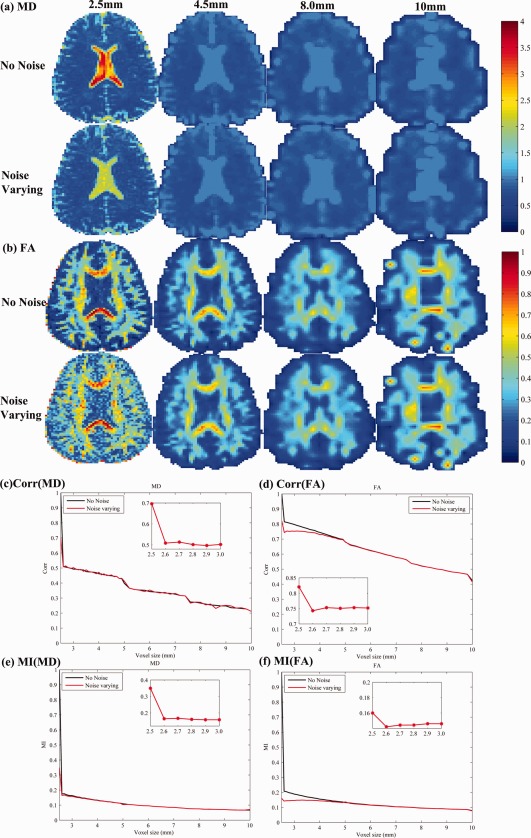
Figure 8.

Errors in DTI‐derived scalar maps as the voxel size increases. Four increasing voxel sizes are shown (shown at the top, from left to right: 2.5, 4, 8, and 10 mm). For each, we computed MD (a) and FA (b) and compared their values with the measures computed at the highest resolution (2.5 mm). The correlations of the MD and FA from downsampled data versus the most accurate measure of MD (c) and FA (d) fall rapidly as the voxel size increases. This deteriorating correlation is found whether noise is artificially added (red curves) or not (black curves). Similar patterns are seen when MI is used to compare downsampled measures with the ground truth.
