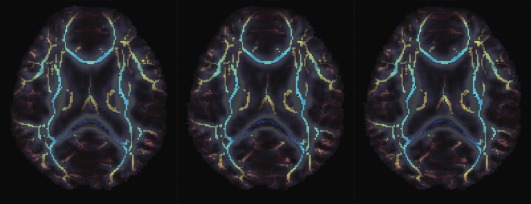
Figure 10.

Mean FA skeleton overlaid on individual subject's FA for three protocols: P1, P2, and P3 (from left to right). There is no obvious visual difference for these TBSS measures; further analysis of longitudinal stability is in Table 2. [Color figure can be viewed in the online issue, which is available at http://wileyonlinelibrary.com.]
