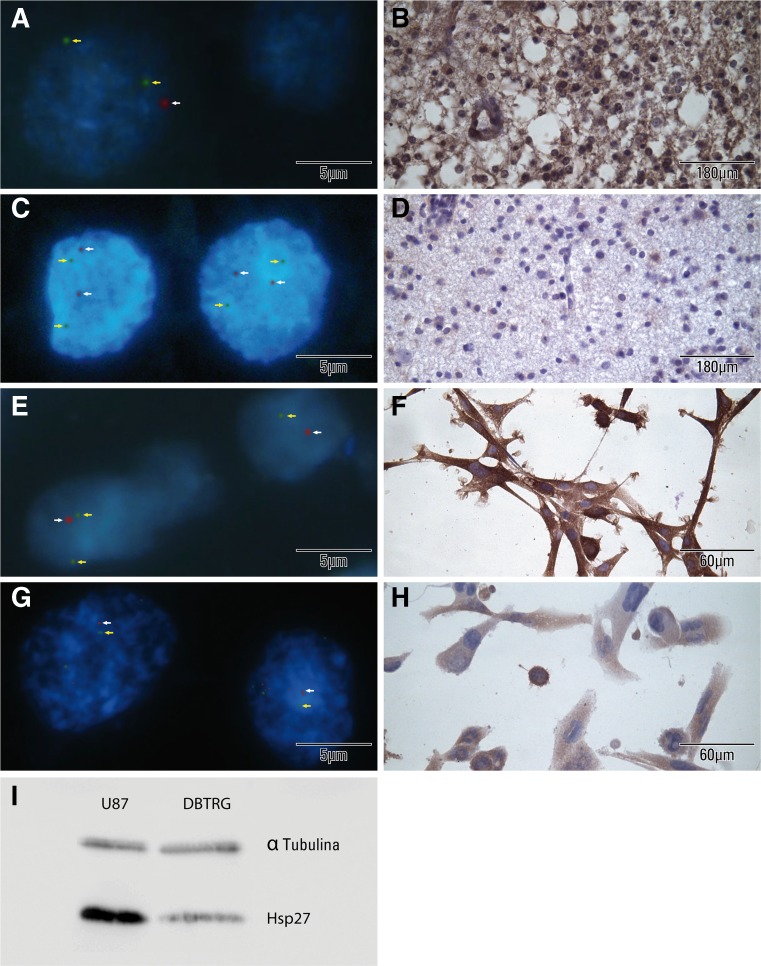
Fig. 5.
Representative FISH and IHC images of oligodendrogliomas and glioma cell lines comparing 1pLOH with Hsp27 expression. Oligodendrogliomas, a nucleus with 1pLOH [using BACs probes 1p (red)/1q (green)]; b in the same tissue, the strong IHC staining for Hsp27; c nuclei with intact 1p [using BACs probes 1p (red)/1q (green)]; d in the same tissue, the negative IHC staining for Hsp27. Glioma cell lines, e nuclei of U87 with 1pLOH [using BACs probes 1p (red)/1q (green)]; f in the same cell line, the strong IHC staining for Hsp27, g nuclei of DBTRG with multiple copies of 1p [using BACs probes 1p (red)/1q (green)]; h in the same cell line, the weak IHC staining for Hsp27. i Immunoblots showing the Hsp27 content in the two cell lines under study. Note that the U87 cells have higher Hsp27 levels compared with the DBTRG cells

