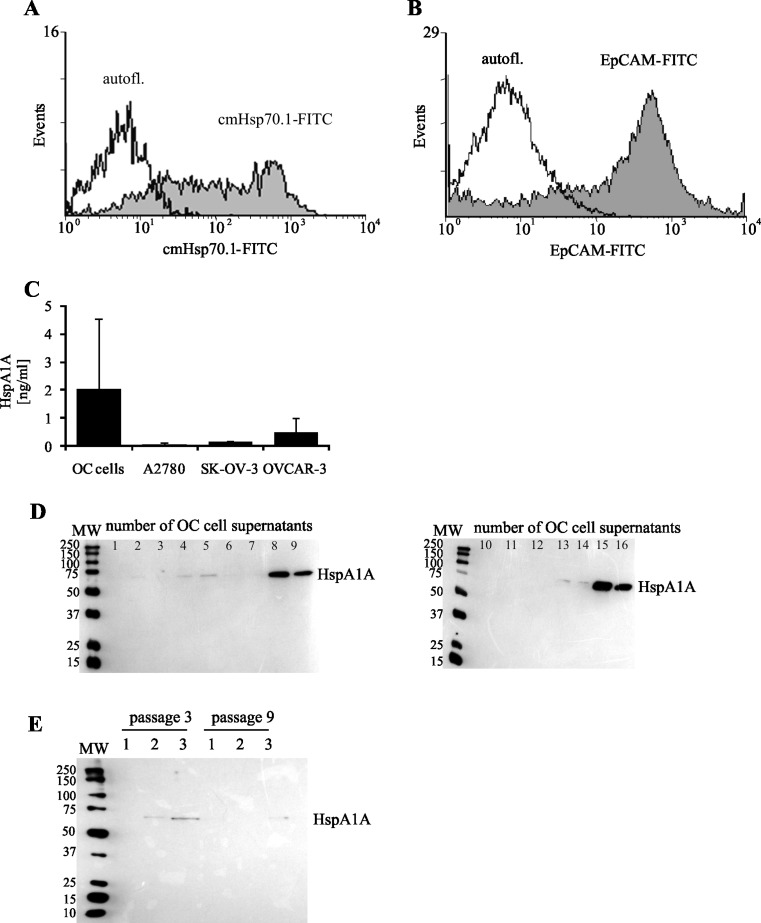
Fig. 3.
Surface and extracellular expression of HspA1A. The representative histograms of a HspA1A and b EpCAM expression on OC cells are demonstrated. OC cells were stained with cmHsp70.1 FITC-conjugated mAbs against membrane-bound HspA1A or with EpCAM FITC-conjugated mAbs for 30 and 10 min, respectively, at 4 °C in the dark. The molecules expression was determined using FCM assay. The gray-filled histograms represent OC cells exposed membrane-bound HspA1A (a) and EpCAM (b) molecules. The solid lines (open histograms) represent the cells in the absence of FITC (autofluorescence). c The amounts of HspA1A present in the supernatants from OC cells and from the ovarian cancer cells lines culture measured using ELISA assay. The data are presented as means ng/ml ± SD, for OC cells (n = 25) and for cancer cell lines (n = 3). Western blot analysis of extracellular HspA1A released d from OC cells and e from ovarian cancer cell lines. Lanes: 1 A2780, 2 SK-OV-3, 3 OVCAR-3. OC supernatants from 16 separate samples and ovarian cancer cell line culture supernatants from two separate passages (as indicated) were analyzed

