Fig. 6.
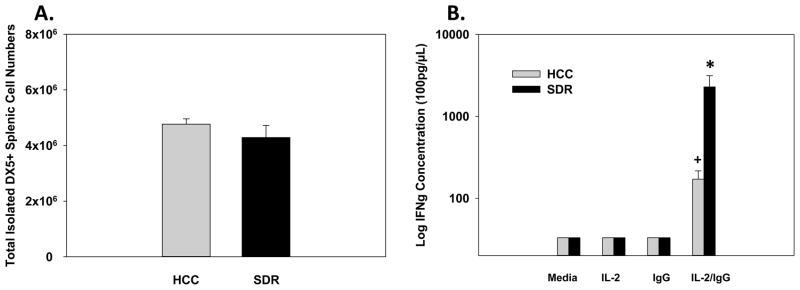
Mean total isolated DX5+ splenic cell numbers (A), 14hrs following 6 consecutive cycles of SDR compared to HCC animals. Fourteen hours post-SDR, splenic DX5+ cells were isolated, incubated for 48hrs with media, IgG, IL-2, or a combination of IgG/IL-2. Mean IFN-γ concentration was determined by ELISA (B). * Indicates a significant difference from DX5+ NK cells from HCC animals treated with IL-2/IgG and all other control groups (p’s≤0.05). + Indicates a significant difference from DX5+ NK cells from SDR-treated animals treated with IL-2/IgG and all other control groups (p’s≤0.05). Bars represent group means ± SEM.

