
Figure 5.
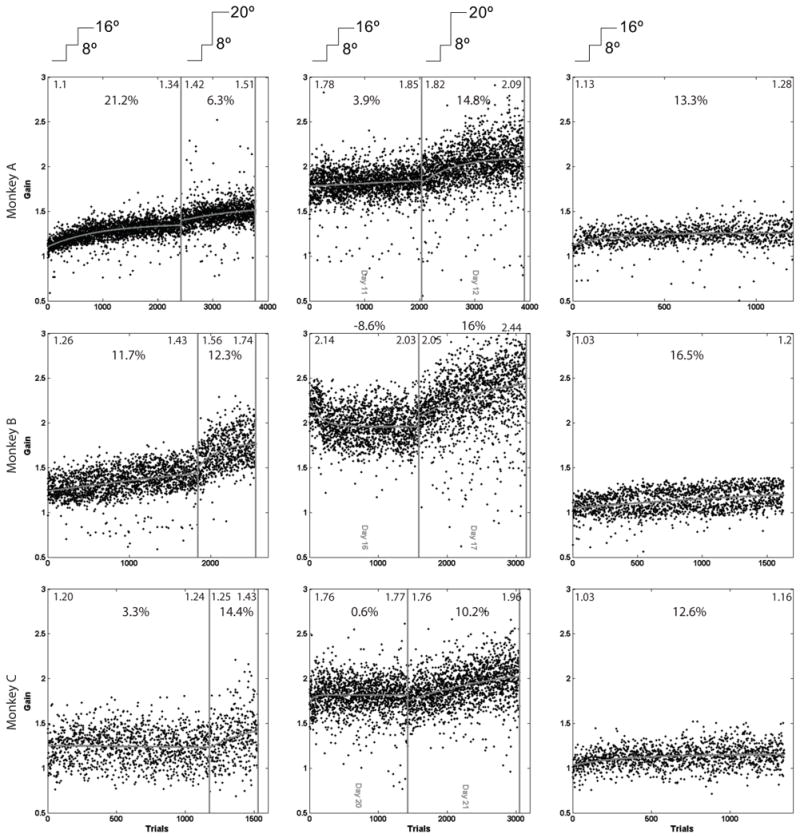
Short-term and long-term adaptations. Left, Gains of saccades during two consecutive size-increasing STSAs. During the first, the target moved from 8° to 16° during saccades. During the second, the target moved from 8° to 20°. Center, Gains of saccades during the last day of an 8° to 16° LTSA immediately followed by an 8° to 20° STSA. Right, Gains during an 8° to 16° STSA. Gray curves are least square fits of increasing exponentials to saccade gains. Numbers at the top of each panel show the percentage increase in the curve between the beginning and end of the panel. Inserts on the top of each panel illustrate target movement. Numbers at the top of each pane show the average of the 50 trials at the start or end of that epoch.