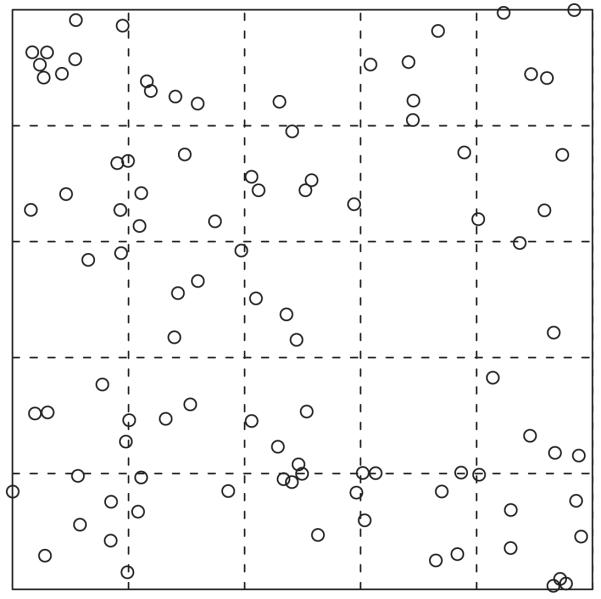
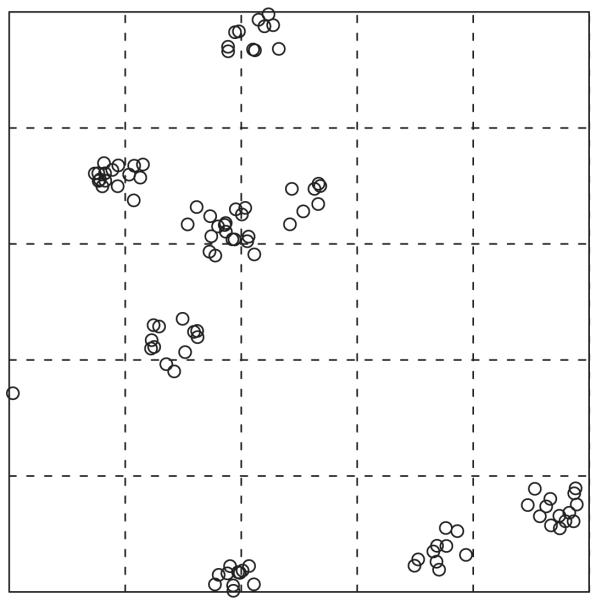
Figure 1.
Simulated spatial data showing homogeneous and clustered processes in the left and right panels, respectively. The dashed lines divide each area into a 5×5 grid. For the homogenous process, the variance and mean of the 25 counts are similar: 3.8 and 4.0 respectively, consistent with a Poisson distribution. For the clustered process, the variance is much larger than the mean: 19.3 versus 3.8, indicating overdispersion. Although these data are spatial, the same principle applies to counts per person, for example. The data were generated using the ‘rpoispp’ and ‘rMatClust’ functions of the ‘spatstat’ package in the R software.


