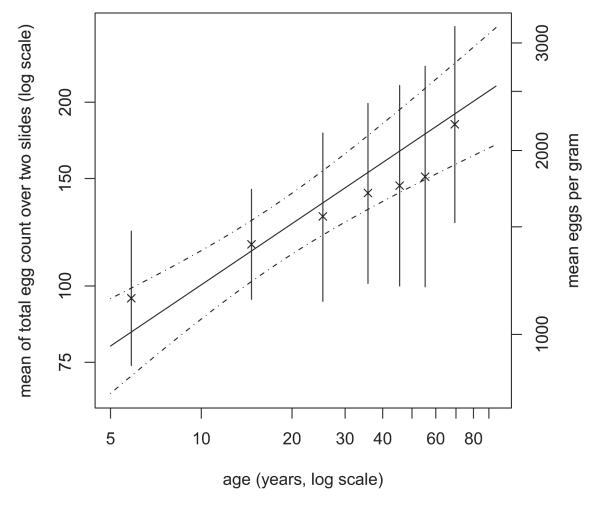
Figure 3.
Negative binomial regression of faecal egg count on age, the sloped solid line showing the fitted values. The × symbols are the means by age group, with vertical solid lines showing the 95% confidence intervals. Although age groups are shown, the fitted model uses the exact age for each person. The curved dashed lines are the pointwise 95% confidence intervals based on the whole dataset.

