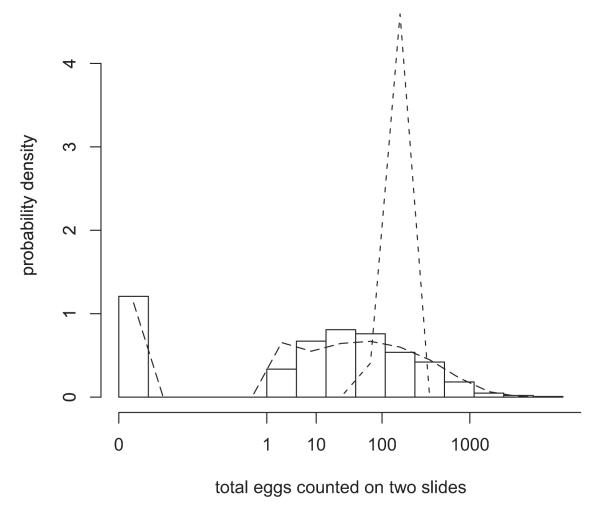
Figure 4.
Histogram of numbers of hookworm eggs counted on two Kato-Katz slides per person in the baseline survey of a prospective study in Brazil. The axis labels show the original values although the scale has been eighth-root transformed. The dashed line is the fitted negative binomial distribution and the dotted line the fitted Poisson.

