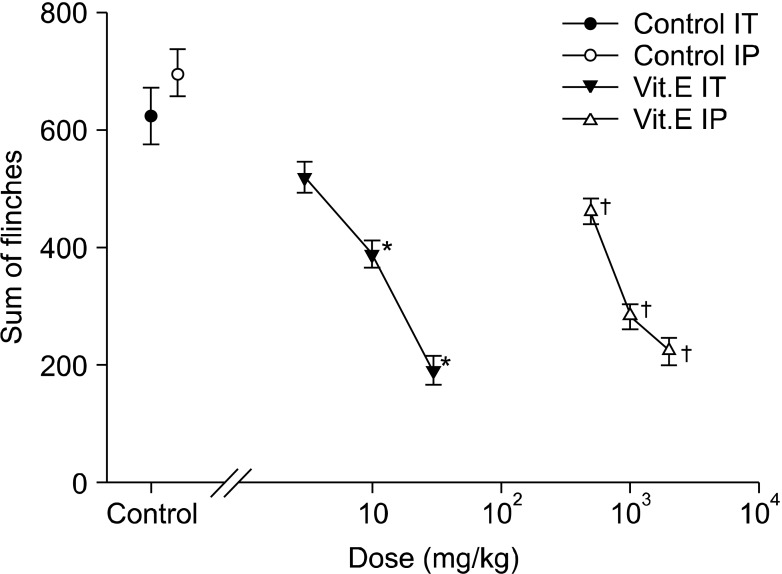
Fig. 4.
Dose-response curve of the late phase in intrathecal and intraperitoneal injection group respective. Each point showed the mean ± SE and significant dose-dependent decreases of flinches in both injection group. IT: intrathecal injection, IP: intraperitoneal injection. *P < 0.05, intrathecal injection compared with the control group. †P < 0.05, intraperitoneal injection compared with the control group.

