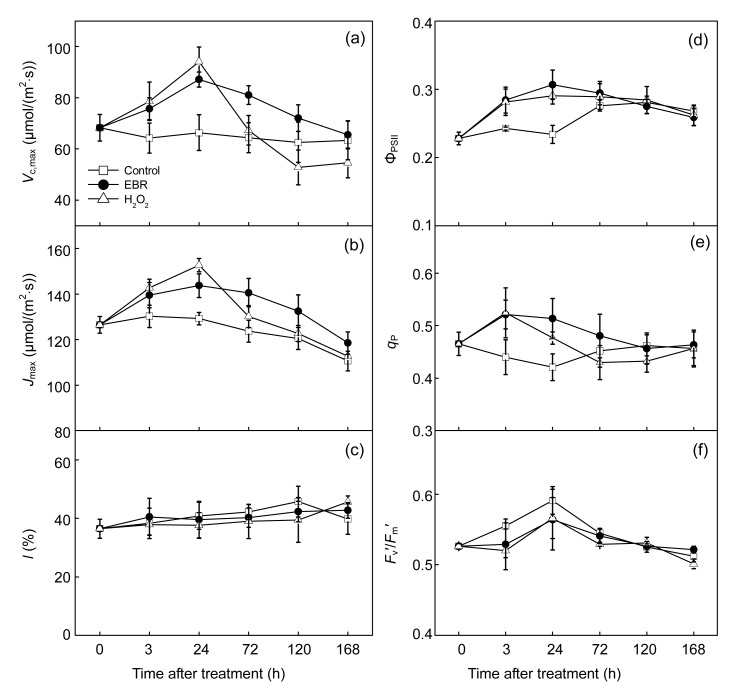
Fig. 2.
Changes in maximum carboxylation rate of Rubisco (V c,max) (a), maximum RuBP regeneration rates (J max) (b), stomatal limitation (l) (c), photochemical efficiency of photosystem II (ΦPSII) (d), photochemical quenching coefficient (q P) (e), and the efficiency of excitation capture by open PSII centers (Fv′/Fm′) (f) for control, EBR-treated, and H2O2-treated plants
Measurements were taken at 1, 2, 3, 6, 9, 24, and 72 h after treatment with 0.1 μmol/L EBR or 5 mmol/L H2O2, respectively. Data are expressed as mean±SD (n=4)

