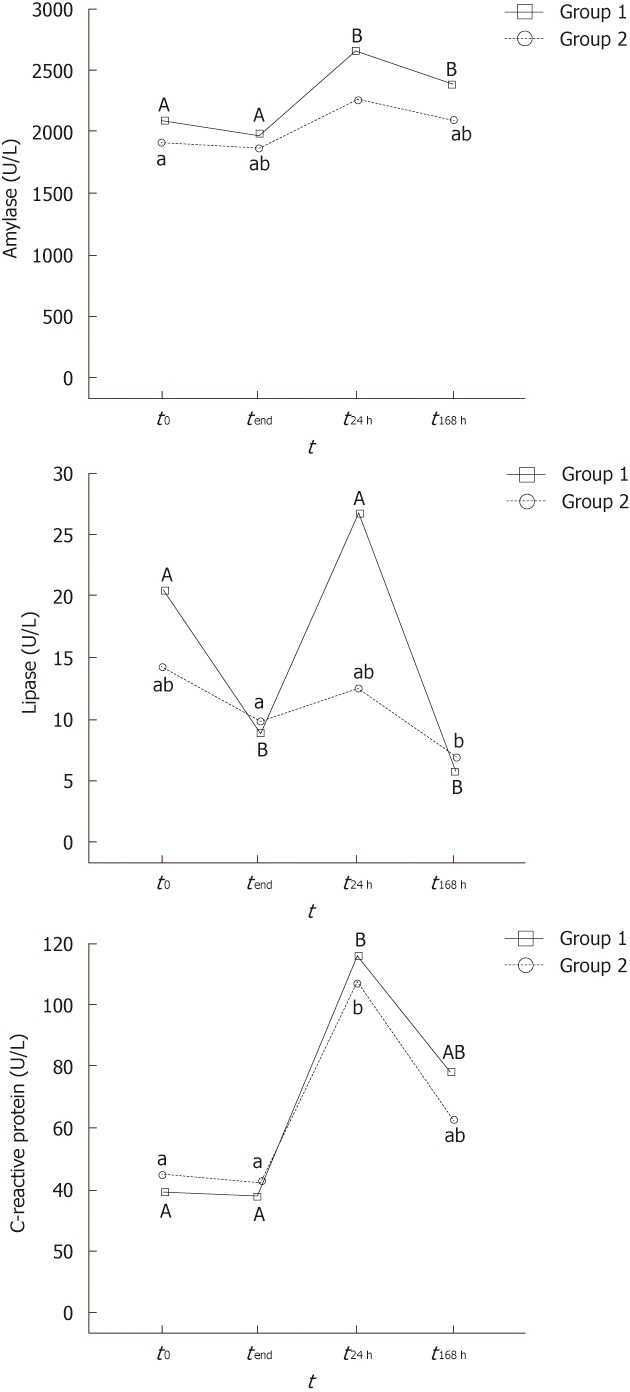
Figure 1.

Plots representing the serum levels of amylase (A), lipase (B) and C-reactive protein (C) for Groups 1 and 2 at different sampling intervals. t0: Samples before the procedure; tend: Samples at the end of the procedure [gastrointestinal endocopy (GI) in control group and double-balloon enteroscopy (DBE) in experimental group]; t24 h: Samples 24 h after the procedure (GI in control group and DBE in experimental group); t168 h: Samples 7 d after the procedure (GI in control group and DBE in experimental group). Within-group differences: sampling stages with no coincident capital (Group 1) or normal case (Group 2) letters were significantly different (P < 0.05). No significantly different results between Groups 1 and 2 were found at any sampling stage.
