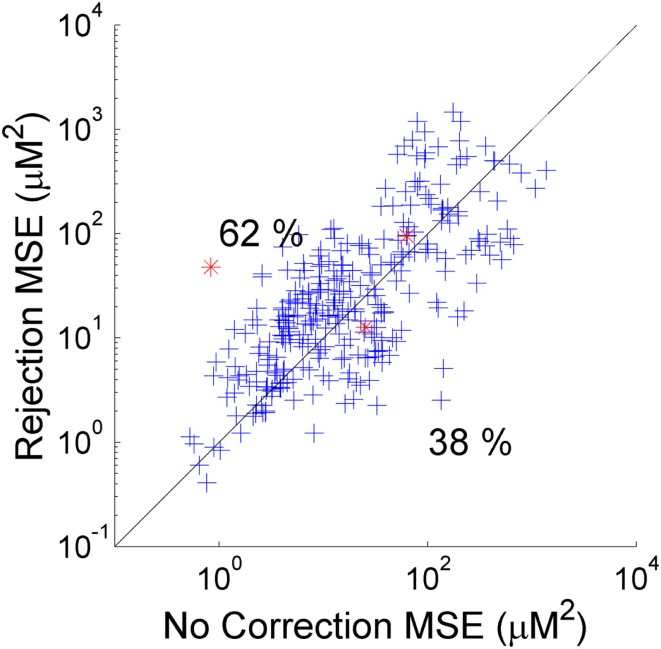
Figure 2.
The MSE between the recovered and true HRF for 300 simulations using trial rejection (y-axis) and no correction (x-axis). Trial rejection produces an increase in MSE in 62% of cases, but there is no statistically significant difference between the MSE achieved by trial rejection and that of no correction. The red asterisks indicate the simulations corresponding to the HRFs shown in Figure 3.

