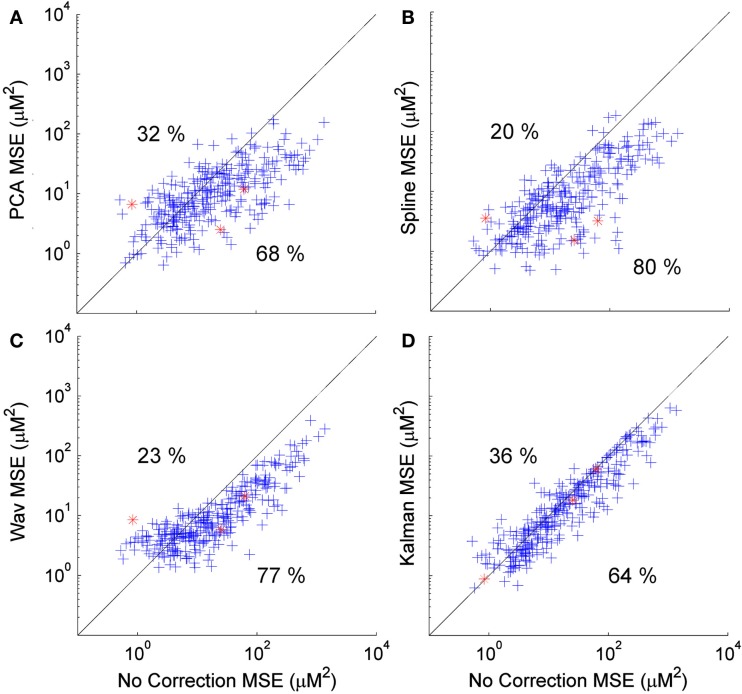
Figure 4.
Scatter plots showing the MSE of each HRF recovered via PCA (A), spline (B), wavelet (C), and Kalman (D) techniques, plotted against that achieved by no correction. A clear trend is apparent for wavelet analysis (and to a lesser extent PCA) that indicates a tendency for the MSE to be increased in cases where the initial (no correction) value was low, while a decrease in MSE is reliably achieved if the initial MSE is high.

