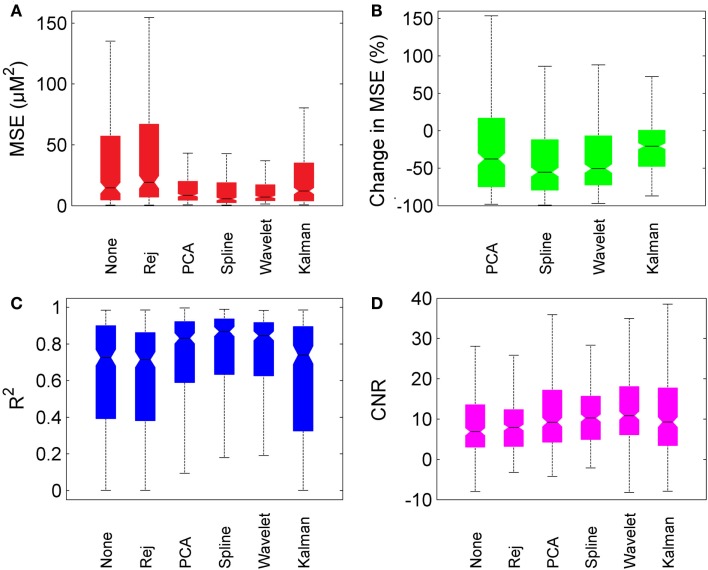
Figure 6.
Overall motion correction results. Each box plot shows the median (line and notch), the 25th and 75th percentiles (the edges of each box) and the most extreme values not considered outliers (whiskers). (A) shows the MSE for no correction (“None”), trial rejection (“Rej”), and each of the four motion correction techniques. (B) shows the percentage change in MSE relative to no correction. (C,D) show R2 and CNR for no correction (“None”), trial rejection (“Rej”), and each of the four motion correction techniques.

