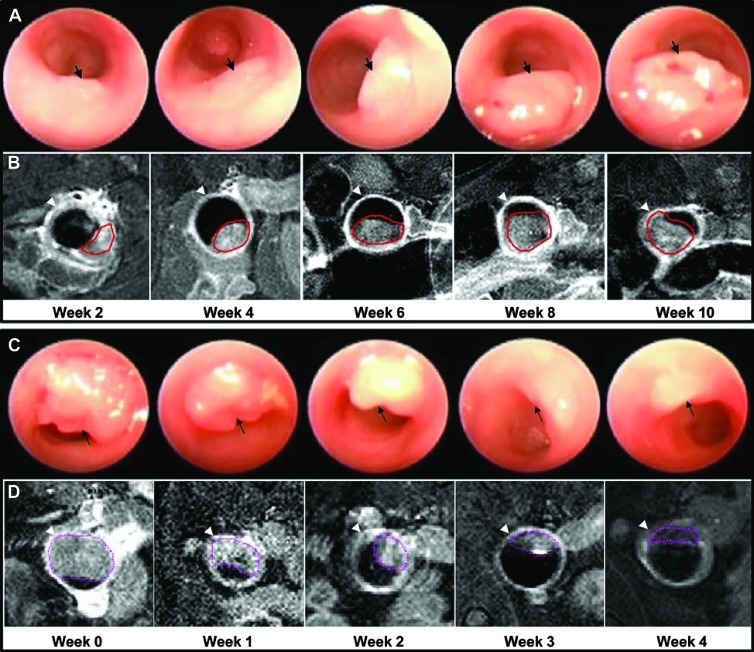
Figure 2.
Monitoring of adenoma growth and regression. (A) In vivo adenoma growth (arrow) on endoscopy is shown over 10 weeks. (B) The same adenoma is shown on T1-weighted axial MRI performed at the same time points. The ROI (red) drawn around the adenoma is used to measure tumor volume. Arrowhead identifies colonic wall. (C) Adenoma regression in response to rapamycin therapy is shown on endoscopy over 4 weeks. (D) The same adenoma is shown on T1-weighted axial MRI with ROI (purple) drawn to measure tumor volume.

