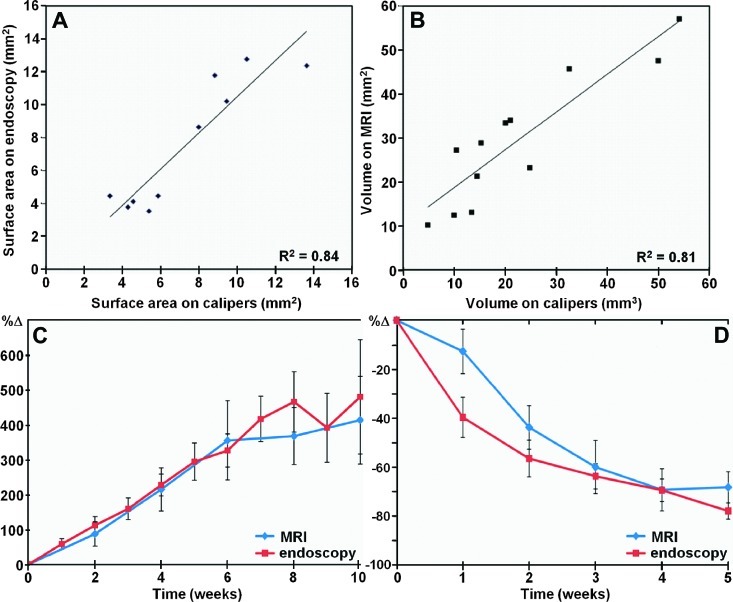
Figure 3.
Validation of adenoma dimensions, growth, and regression. (A) Surface areas of adenomas measured on endoscopy in vivo are compared with that evaluated postmortem with calipers (R2 = 0.84). (B) Volumes of adenomas measured on MRI in vivo are compared with that evaluated postmortem with calipers (R2 = 0.81). (C) Comparison of adenoma growth rate in percent change (%Δ). (D) Comparison of adenoma regression rate in percent change (%Δ) in response to rapamycin therapy.

