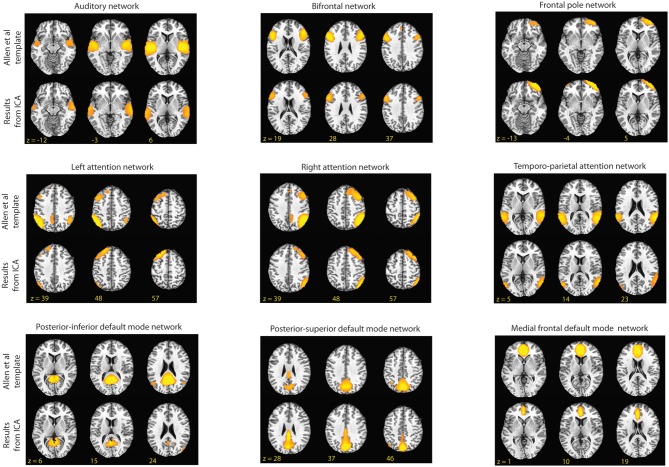
Figure 2.
Shown above are the RSNs identified by Allen et al. and the component from our group ICA that had the highest spatial correlation to the Allen et al. templates (2011). In this figure, for the templates the threshold is set at t = 45 and for the matching components from our data the threshold is set at z = 3.0.

