Figure 1.
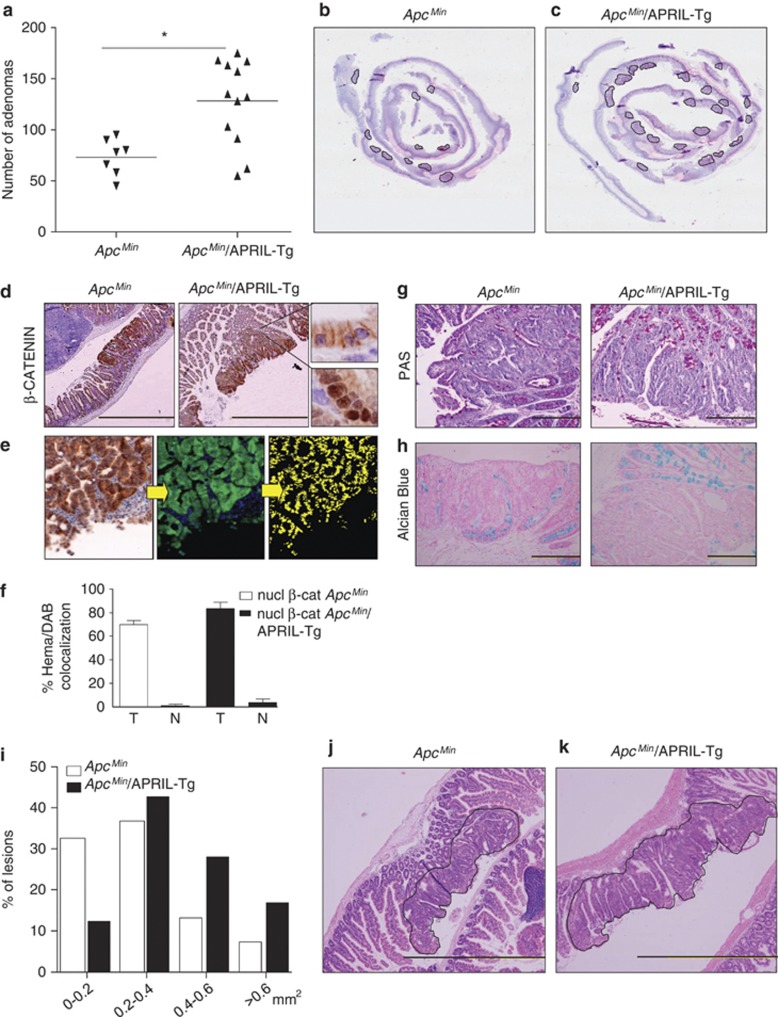
Ectopic expression of APRIL promotes tumor lesions in ApcMin mice. ApcMin mice were crossed with APRIL-Tg mice and offspring was analyzed for intestinal adenoma formation (ApcMin n=7; APCMin/APRIL-Tg n=12). Lesions were quantified after 13 weeks. (a) ApcMin/APRIL-Tg mice display increased adenoma incidence in comparison with the ApcMin littermates. Solid lines represent the mean value for each group. Mann–Whitney test, P-value is 0.0127. (b and c) Hematoxylin and eosin staining of adenomas in ApcMin and ApcMin/APRIL-Tg mice. Representative section of ‘Swiss rolled' ileum. (d–f) β-Catenin staining of representative lesions in the ApcMin and ApcMin/APRIL-Tg. Scale bar, 500 μm. Amplifications show nuclear and membrane-bound β-catenin. (e) Nuclear β-catenin quantification by colocalization with hematoxylin using spectral imaging. IHC photomicrograph, on the first step DAB is converted into fluorescent green, and hematoxylin into fluorescent blue by CRi Nuance v2.8 software, colocalization of both is represented in yellow in the second step. (f) Quantification of colocalization in the different scanned areas (T=tumor; N=normal). (g) PAS and (h) Alcian Blue staining of representative section. Lesions are surrounded by a black line. (i and j) Hematoxylin and eosin staining of representative adenomas in ApcMin and ApcMin/APRIL-Tg mice. Lesions are surrounded by a black line. (k) APCMin/APRIL-Tg display larger lesion surface. Tumor size distribution in mm2

