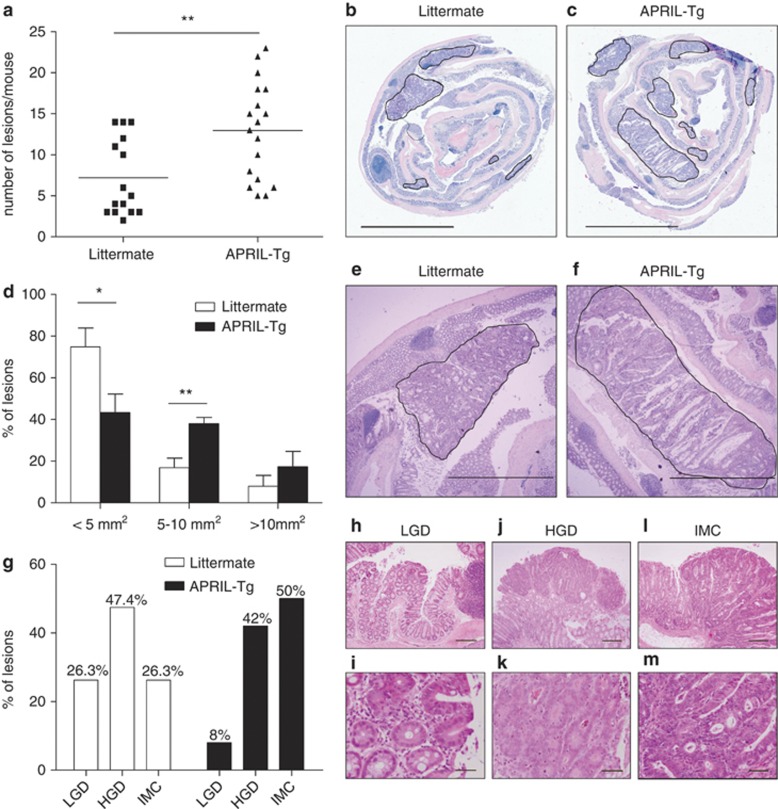
Figure 2.
APRIL-Tg mice display increased tumor incidence and enlarged adenocarcinomas in a colitis-associated cancer model. Colorectal tumors were induced in 6- to 8-week-old littermate (n=15) and APRIL-Tg mice (n=18) treated with AOM/DSS. (a) After 60 days, tumor incidence per mouse was determined. Solid lines represent the mean value for each group. The statistical significance of the data was determined using Mann–Whitney test, P-value 0.0033. (b, c and e, f) Representative sections of ‘Swiss rolled' colons. Hematoxylin and eosin stainings of adenomas in littermates (b and e) or APRIL-Tg (c and f). Tumors are surrounded by a black line. (d) Tumor size distribution in littermate (n=15) and APRIL-Tg mice (n=18) treated with AOM/DSS. Data shown are mean±S.E.M. P-value 0.0221 for <5 mm2 lesions, P-value 0.0047 for 5–10 mm2 lesions. (g) APRIL-Tg mice induced with AOM/DSS display a reduced amount of low-grade dysplasia (LGD) and increased numbers of intramucosal carcinoma (IMC) as compared with their littermates; HGD, high-grade dysplasia are similar. (h–m) Representative images visualizing the three dysplastic categories of adenomas scored: (h and i) photomicrograph of an incipient low-grade lesion located on the tip of a mucosal fold. Inset shows basally oriented, small nuclei and diminished goblet cell differentiation (original magnification, × 64 (h); × 320 (i). (j and k) High-grade lesion displaying back-to-back glands with pseudostratified nuclei with open chromatin and frequent mitoses (original magnification, × 40 (j); × 200 (k). (l and m) Large lesion displaying irregular glandular arrangements with complete loss of apicobasal orientation, many apoptotic bodies and intraglandular necrotic debris, consistent with intramucosal carcinoma (original magnification, × 40 (l); × 200 (m)

