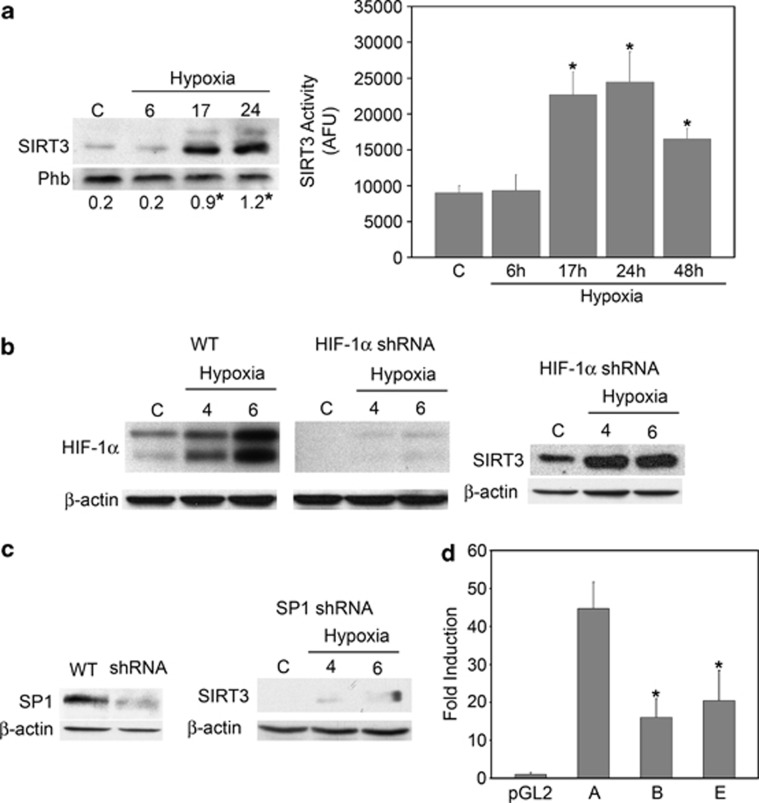
Figure 6.
SP1 regulates SIRT3 increase under hypoxia. (a) Left side, MDA-MB-231 cells were incubated under normoxic or hypoxic conditions. After the times indicated, cells were processed to obtain a mitochondrial extracts as described under Materials and Methods. The contents of SIRT3 were determined by western blotting. Phb was used as loading control for the mitochondrial fraction. Blots are representative of at least three separate experiments. Numbers below the blots represent average SIRT3 level, relative to Phb. *Significantly different from control normoxic cells (C). Significance was set at P<0.05. Right side, MDA-MB-231 cells were incubated under normoxic or hypoxic conditions. After the times indicated, SIRT3 deacetylase activity was measured on mitochondrial fractions as described under Materials and Methods. Data are representative of at least three separate experiments. Values are represented as mean±S.D. *Significantly different from control normoxic cells. Significance was set at P<0.05. (b) MDA-MB-231 cells either silenced for HIF-1α or transduced with lentiviral empty control particles were incubated under normoxic or hypoxic conditions. After the times indicated, cells were processed to obtain a whole-cell extracts as described under Materials and Methods. The content of HIF-1α (left side) and SIRT3 (right side) were determined by western blotting. β-Actin was used as a whole cells loading control. Blots are representative of at least three separate experiments. C, control normoxic cells. (c) MDA-MB-231 either silenced for SP1 or transduced with lentiviral empty control particles were processed to obtain a whole-cell extract as described under Materials and Methods. The content of SP1 was determined by western blotting (left side). SP1-silenced cells were incubated under normoxic or hypoxic conditions for the times indicated. The content of SIRT3 was measured by western blotting (right side). β-Actin was used as a loading control. Blots are representative of at least three separate experiments. C, control normoxic cells. (d) Luciferase expression after transient transfection of pGL2 plasmid containing multiple SP1 binding sites of SIRT3 promoter (A), pGL2 plasmid deleted of all the SP1 binding sites of SIRT3 promoter (B) and pGL2 plasmid deleted of three SP1 binding sites of SIRT3 promoter (E) with respect to the pGL2-basic vector. The values reported are the means±S.D. of three independent experiments. *Significantly different from plasmid A. Significance was set at P<0.05

