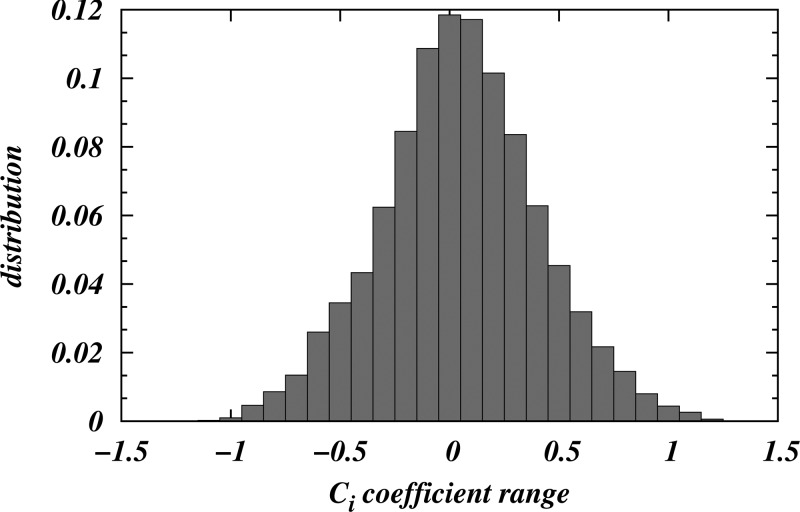
Figure 4.
Distribution of {Ci} coefficients from the fitting of the C5A bead positions from the simulations to the analytical TPMS approximation (see Methods). The standard deviation of the distribution is ∼0.4. The χ2 test established the significance of the fit with probability p < 0.05.

