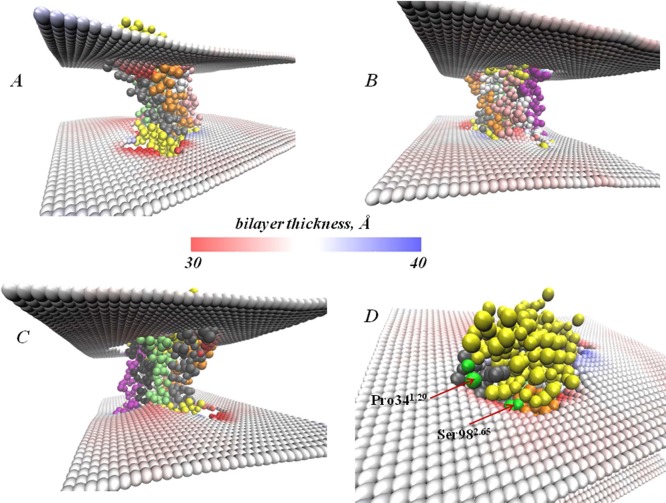
Figure 5.
(A–C) Views of membrane deformation patterns around the rhodopsin immersed into 9.9 MAG lamellar bilayers. The average positioning of membrane leaflets is identified by the two surfaces colored according to the local thickness of the bilayer (see the bar for color definition). The GPCR is shown in van der Waals representation with the TM helices colored as follows: TM1 in gray, TM2 in orange, TM3 in white, TM4 in pink, TM5 in purple, TM6 in black, and TM7 in lime The rest of the protein (loops, etc.) is rendered in yellow. The membrane representation is focused on the region near the protein. (D) Magnified view of the region containing residues Pro341.29 and Ser982.65 (both rendered in green) showing the membrane deformations in their vicinity.

