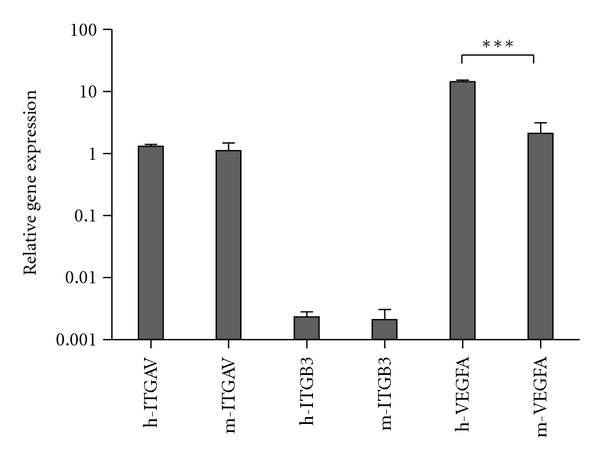
Figure 2.

Relative gene expression of human (h) and mouse (m) Integrin α V (ITGAV), Integrin β 3 (ITGB3), and VEGFA in H727 tumors in nude mice 2 hours after injection of 64Cu-NODAGA-c(RGDyK). Gene expression level for h-VEGFA is significantly higher than the gene expression level for m-VEGFA (P < 0.001). No significant difference in gene level was found for the integrins. Please note that the y-axis of the graph is in logarithmic scale.
