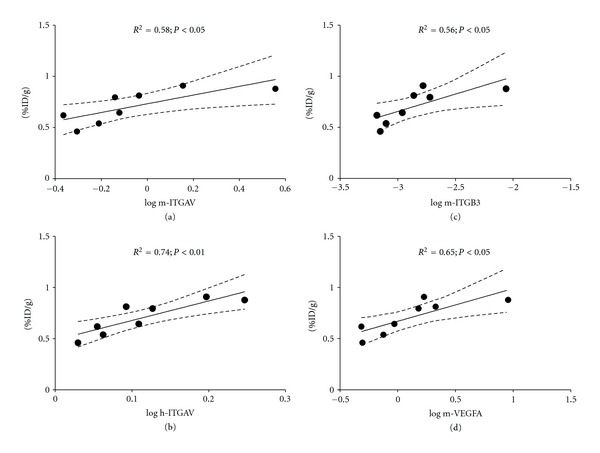
Figure 3.

Univariate regression of mouse (m) or human (h) gene expression relative to %ID/g. (a) m-ITGAV, (b) h-ITGAV, (c) m-ITGB3 and (d) m-VEGFA, all versus %ID/g at 2 h after injection of 64Cu-NODAGA-c(RGDyK). All relative gene expression results plotted are log10 transformed. The 95% confidence interval is indicated by the dotted lines.
