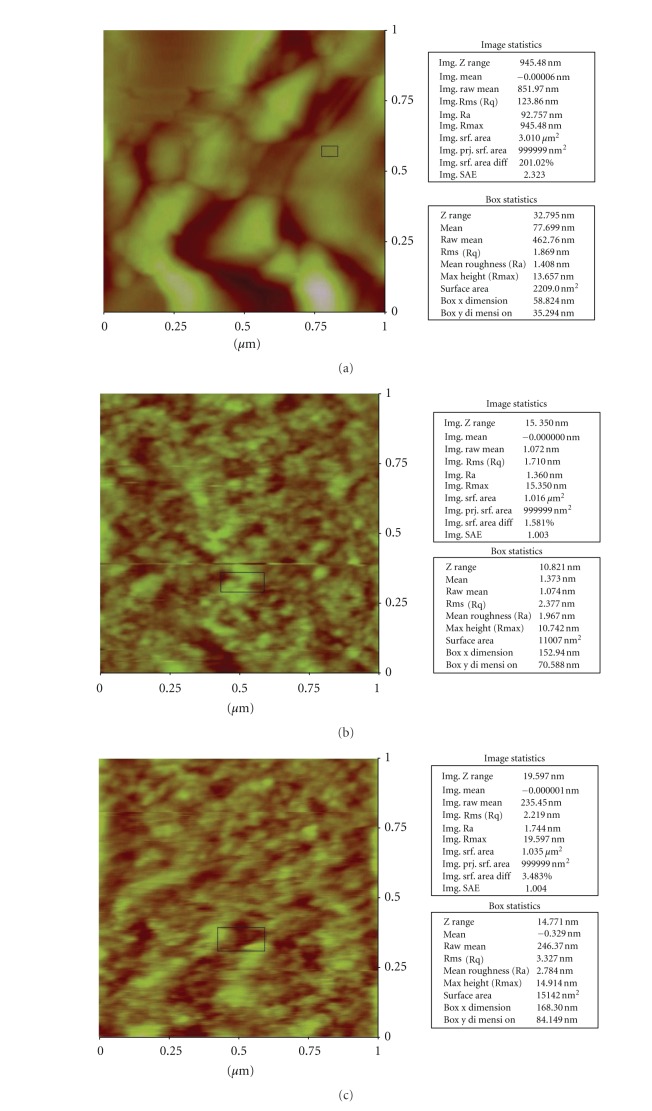
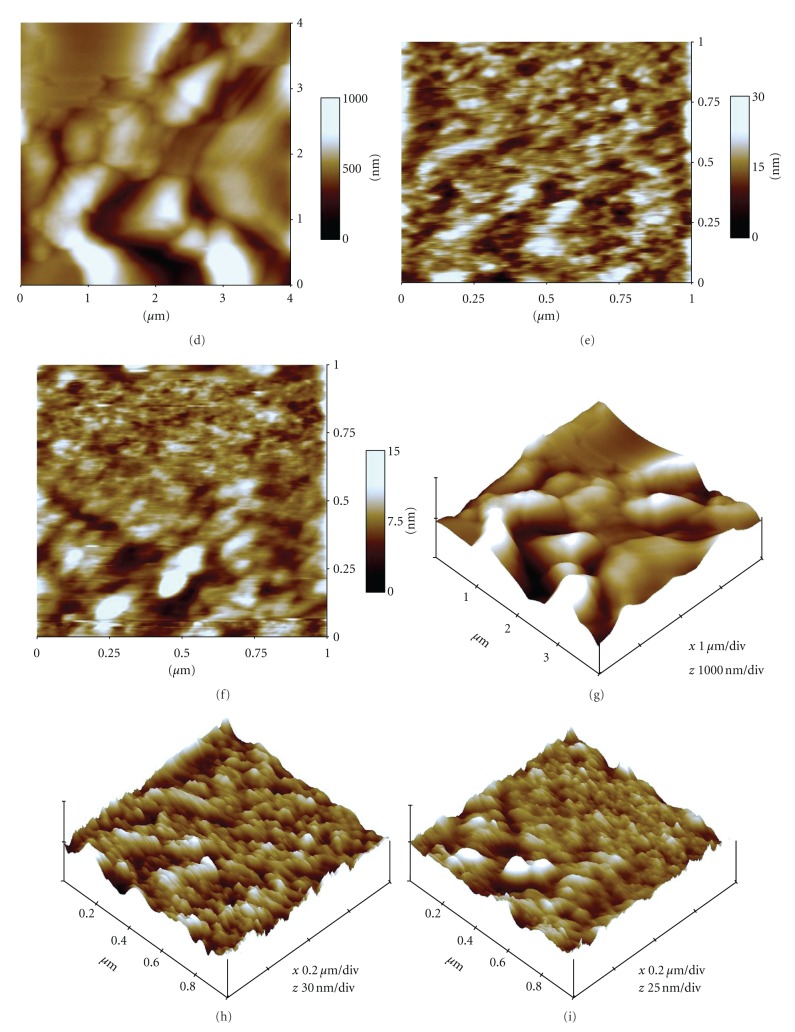
Figure 4.
Atomic force micrographs showing variation in image statistics, height, and three-dimensional view of untreated, LGO-treated and LGOV-treated E. coli cells. (a) The root mean square values and surface area difference of untreated E. coli cells (rms 1.86 nm, sad 201.02%). (b) LGO-treated (rms 2.33 nm, sad 1.58%). (c) LGOV-treated (rms 3.32 nm, sad 3.48%). (d) Height of the untreated E. coli cells from the glass surface (h 450 nm). (e) LGO-treated (h 14 nm). (f) LGOV-treated (h 7 nm). (g) Z-axis value for three-dimensional structure of untreated E. coli cells (z 1000 nm/div). (h) LGO-treated (z 30 nm/div). (i) LGOV-treated (z 25 nm/div).


