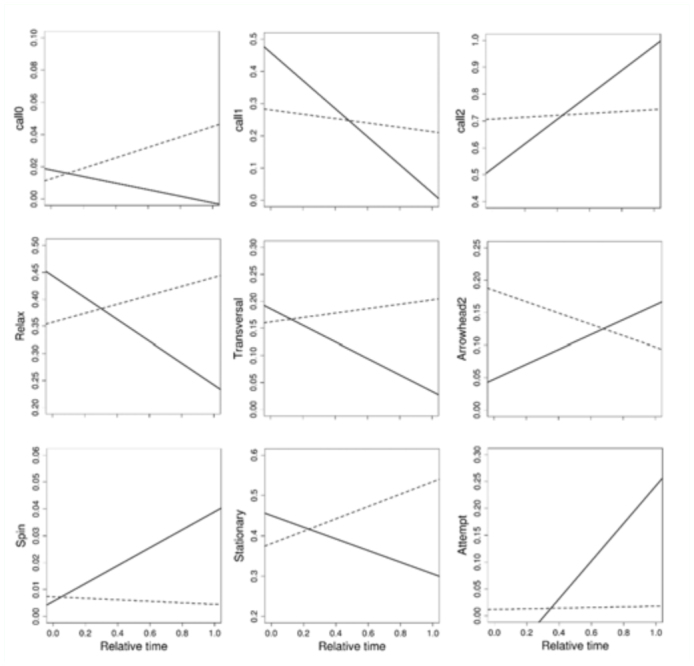
Figure 1.

Regression plots representing the time spent on each activity (described in Table 1) as a function of the relative time taken between female release and copulation or the end of the observation period. Only the cases where the interaction component in Table 3 was significant are illustrated. Solid line = Successful individuals (S). Dotted line = Unsuccessful individuals (U). High quality figures are available online.
