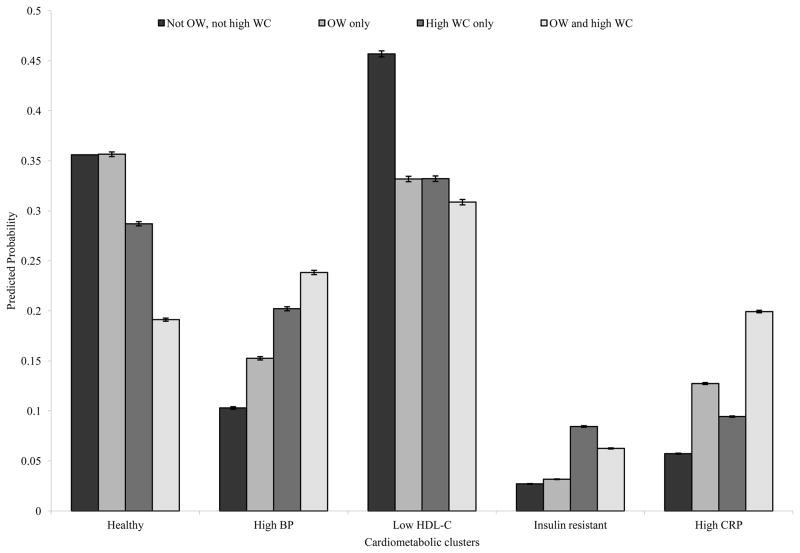
FIGURE 2.
Predicted probabilities of cluster membership with different combinations of high waist circumference and overweight status
Predicted probabilities of being in one of the cardiometabolic clusters given four different populations: a population where no one is overweight (OW) nor with high waist circumference (WC), a population where everyone is OW in the absence of high WC, a population where everyone has high WC in the absence of OW, and a population where everyone is both OW and with high WC. Probabilities were calculated after running the multinomial logistic regression model.

