
Table 1.
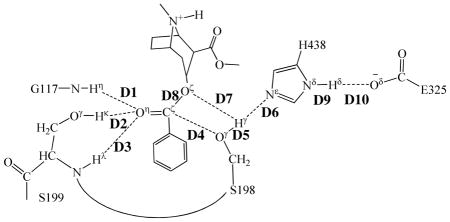
Key internuclear distances (D1 to D10, in angstrom) in the QM/MM-optimized geometries of the key states of the acylation stage.
| |||||||
|---|---|---|---|---|---|---|---|
| ES | TS1 | INT1 | TS2 | INT1′ | TS2′ | INT2 | |
| D1 | 1.88 | 1.92 | 1.98 | 1.97 | 2.00 | 2.02 | 1.99 |
| D2 | 1.90 | 1.79 | 1.73 | 1.72 | 1.70 | 1.68 | 1.69 |
| D3 | 2.55 | 2.27 | 2.15 | 2.03 | 1.98 | 1.97 | 1.98 |
| D4 | 2.86 | 2.03 | 1.55 | 1.39 | 1.37 | 1.35 | 1.33 |
| D5 | 1.00 | 1.52 | 1.90 | 2.24 | 2.23 | 2.37 | 2.94 |
| D6 | 1.78 | 1.11 | 1.04 | 1.02 | 1.02 | 1.18 | 2.73 |
| D7 | 3.69 | 3.09 | 3.13 | 3.31 | 3.31 | 1.33 | 0.97 |
| D8 | 1.36 | 1.42 | 1.54 | 2.09 | 2.30 | 2.39 | 2.64 |
| D9 | 1.05 | 1.07 | 1.09 | 1.08 | 1.08 | 1.07 | 1.05 |
| D10 | 1.74 | 1.60 | 1.56 | 1.59 | 1.59 | 1.67 | 1.71 |