
Table 2.
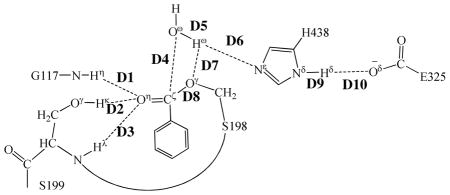
Key internuclear distances (D1 to D10, in angstrom) in the QM/MM-optimized geometries of the key states of the deacylation stage
| |||||
|---|---|---|---|---|---|
| INT2′ | TS3 | INT3 | TS4 | PD | |
| D1 | 1.88 | 1.89 | 1.88 | 1.80 | 1.81 |
| D2 | 1.62 | 1.57 | 1.56 | 1.64 | 1.68 |
| D3 | 1.97 | 1.90 | 1.90 | 1.99 | 2.09 |
| D4 | 2.55 | 1.79 | 1.63 | 1.40 | 1.35 |
| D5 | 1.00 | 1.34 | 1.47 | 2.41 | 2.80 |
| D6 | 1.65 | 1.15 | 1.09 | 1.26 | 1.72 |
| D7 | 2.77 | 2.58 | 2.53 | 1.24 | 1.00 |
| D8 | 1.34 | 1.42 | 1.46 | 1.95 | 2.50 |
| D9 | 1.05 | 1.07 | 1.07 | 1.06 | 1.05 |
| D10 | 1.66 | 1.58 | 1.56 | 1.62 | 1.69 |