
Figure 2.
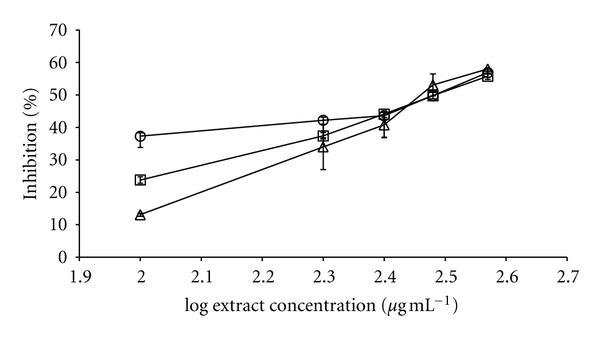
Dose-response curves of the hydroalcoholic extracts from Camellia sinensis (◯), Ludwigia octovalvis (▵), and Tecoma stans (□) leaves in the in vitro lipase inhibition model. x-axis = log concentration in μg·mL−1; y-axis= inhibition percentage.