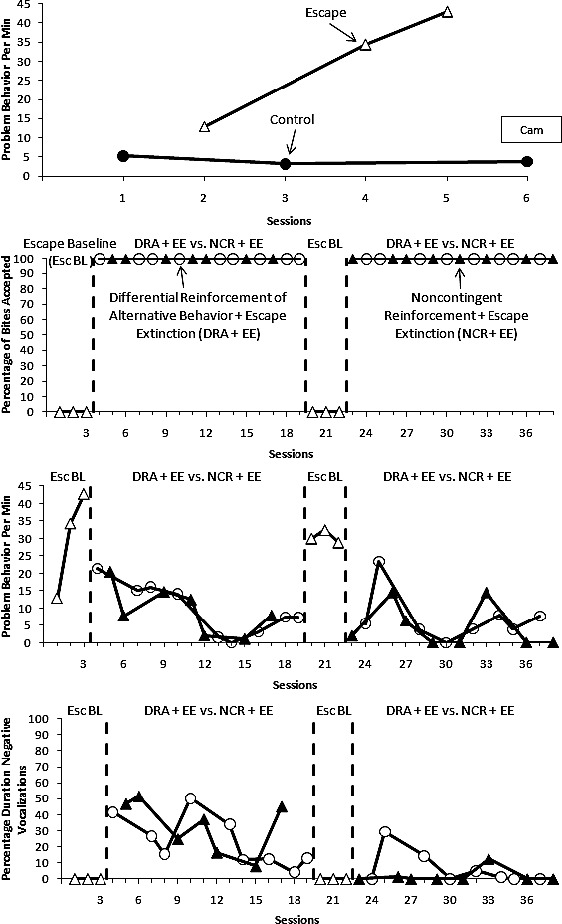
Figure 1.

Problem behavior per minute during the functional analysis (top panel) and percentage of bites accepted (second panel), problem behavior per minute (third panel), and percentage of negative vocalizations (bottom panel) during the treatment evaluation.
